
Faili:South Africa 2011 dominant language map.svg

Size of this PNG preview of this SVG file: piseli 684 × 599. Ukubwa zingine: piseli 274 × 240 | piseli 548 × 480 | piseli 876 × 768 | piseli 1,168 × 1,024 | piseli 2,337 × 2,048 | piseli 809 × 709.
Faili halisi (faili la SVG, husemwa kuwa piseli 809 × 709, saizi ya faili: 798 KB)
| Faili hili linatoka Wikimedia Commons. Maelezo yapo kule kwenye ukurasa wake wa maelezo unaonekana hapo chini.
|
Muhtasari
| Maelezo |
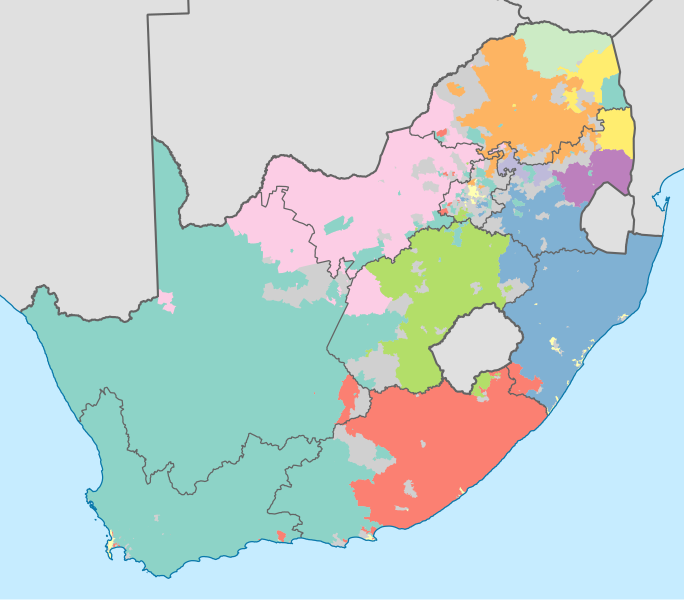
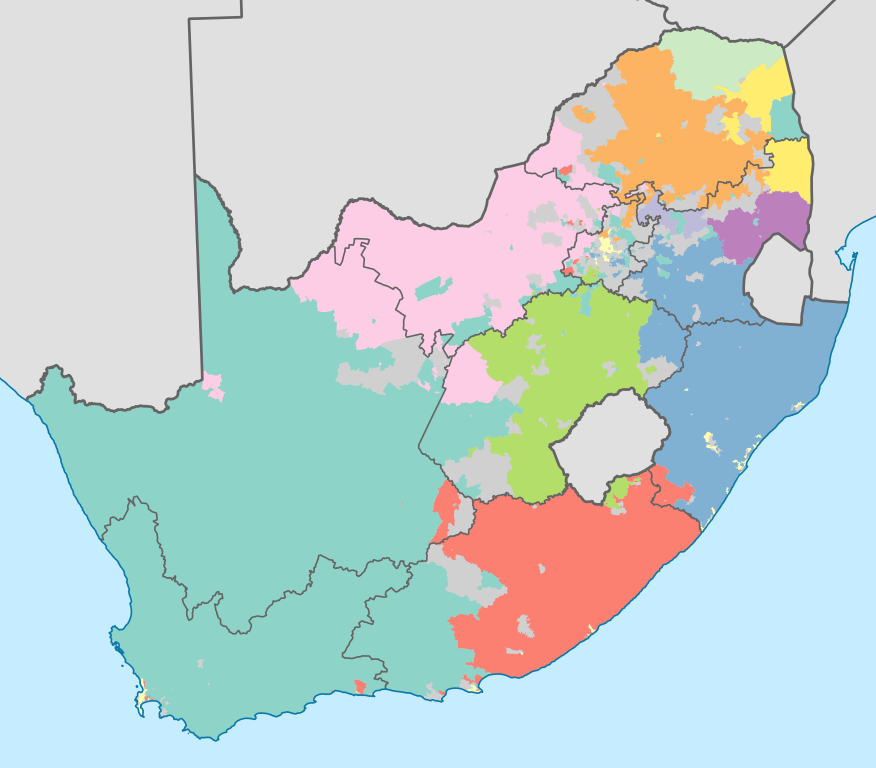
English: Map showing the dominant home languages in South Africa, based on ward-level data from the 2011 census. In this context, a language is dominant if it more than 50% of the population in a ward speak it at home, or more than 33% speak it and no other language is spoken by more than 25%.
English
Afrikaans
isiNdebele
isiXhosa
isiZulu
Sesotho sa Leboa
Sesotho
Setswana
siSwati
Tshivenda
Xitsonga
No language dominant
Projection is Albers Equal-Area Conic, with standard parallels at 25.5° S and 31.5° S, and origin at 28.5° S 24.5° E. |
| Tarehe | |
| Chanzo | Statistics South Africa's Census 2011 is the source of the basic population data. The map results from my own processing of the data. For ward boundaries see File:South Africa electoral wards 2011 blank.svg. |
| Mwandishi | Htonl |
| Matoleo mengine |
South Africa 2011 dominant language map (hex cells).svg: .svg) |
Hatimiliki
The following license applies to the population data on which the map is based:

|
The copyright holder of this file, Stats SA, allows anyone to use it for any purpose, provided that the copyright holder is properly attributed. Redistribution, derivative work, commercial use, and all other use is permitted. |
Sifa:
"the user acknowledges Stats SA as the source of the basic data wherever they process, apply, utilise, publish or distribute the data, and also that they specify that the relevant application and analysis (where applicable) result from their own processing of the data" [1]
|
The following tag applies to the map itself:
| I, the copyright holder of this work, release this work into the public domain. This applies worldwide. Katika nchi zingine hii haiwezekani kisheria; kama ni hivyo: I grant anyone the right to use this work for any purpose, without any conditions, unless such conditions are required by law. |
Historia ya faili
Bonyeza tarehe/saa kuona faili kama ilivyoonekana wakati huo.
| Tarehe/Saa | Picha ndogo | Vipimo | Mtumiaji | Maelezo | |
|---|---|---|---|---|---|
| sasa hivi | 21:09, 18 Novemba 2012 | | 809 × 709 (798 KB) | Htonl | =={{int:filedesc}}== {{Information |Description={{en|1=Map showing the dominant home languages in South Africa, based on ward-level data from the 2011 census. In this context, a language is dominant if it more than 50% of the population in a ward speak... |
Matumizi ya faili
Ukurasa huu umeunganishwa na faili hili:
Matumizi ya faili ulimwenguni
Wiki nyingine hutumia faili hizi:
- Matumizi kwa af.wikipedia.org
- Matumizi kwa cs.wikipedia.org
- Matumizi kwa de.wikipedia.org
- Matumizi kwa dsb.wikipedia.org
- Matumizi kwa en.wikipedia.org
- Matumizi kwa eo.wikipedia.org
- Matumizi kwa frr.wikipedia.org
- Matumizi kwa fr.wikipedia.org
- Matumizi kwa fr.wiktionary.org
- Matumizi kwa he.wikipedia.org
- Matumizi kwa it.wikipedia.org
- Matumizi kwa ka.wikipedia.org
- Matumizi kwa ko.wikipedia.org
- Matumizi kwa lb.wikipedia.org
- Matumizi kwa ml.wikipedia.org
- Matumizi kwa mzn.wikipedia.org
- Matumizi kwa no.wikipedia.org
- Matumizi kwa pt.wikipedia.org
- Matumizi kwa rm.wikipedia.org
- Matumizi kwa ro.wikipedia.org
- Matumizi kwa ru.wikipedia.org
- Matumizi kwa sh.wikipedia.org
- Matumizi kwa simple.wikipedia.org
- Matumizi kwa sr.wikipedia.org
- Matumizi kwa ss.wikipedia.org
- Matumizi kwa sv.wikipedia.org
- Matumizi kwa szl.wikipedia.org
- Matumizi kwa te.wikipedia.org
- Matumizi kwa tg.wikipedia.org
- Matumizi kwa tr.wikipedia.org
- Matumizi kwa uk.wikipedia.org
- Matumizi kwa xh.wikipedia.org
- Matumizi kwa zh.wikipedia.org
- Matumizi kwa zu.wikipedia.org