
Faili:Supercomputing-rmax-graph2.svg

Size of this PNG preview of this SVG file: piseli 800 × 514. Ukubwa zingine: piseli 320 × 206 | piseli 640 × 411 | piseli 1,024 × 658 | piseli 1,280 × 823 | piseli 2,560 × 1,646 | piseli 1,260 × 810.
Faili halisi (faili la SVG, husemwa kuwa piseli 1,260 × 810, saizi ya faili: 60 KB)
| Faili hili linatoka Wikimedia Commons. Maelezo yapo kule kwenye ukurasa wake wa maelezo unaonekana hapo chini.
|
Muhtasari
| Maelezo |
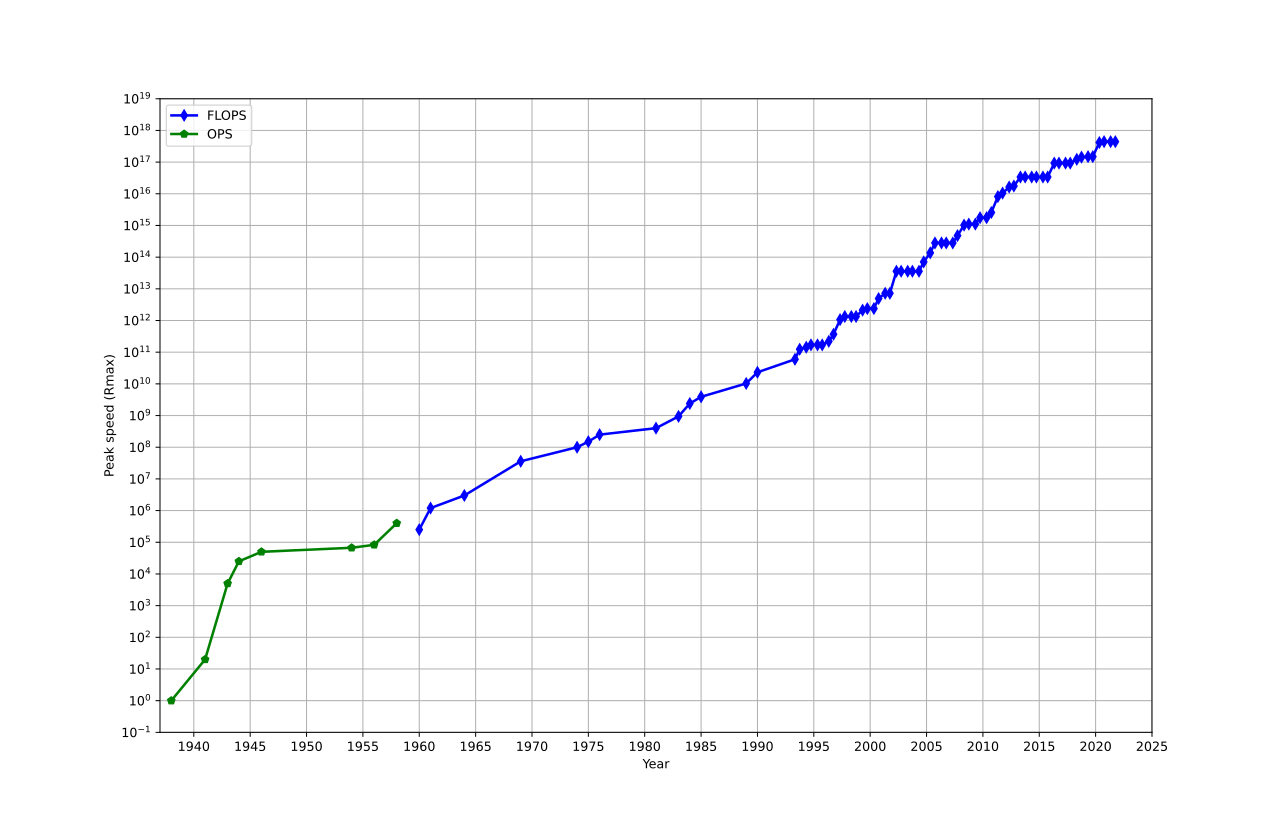
English: Plot of highest supercomputer performance over time |
| Tarehe | |
| Chanzo | Kazi yangu |
| Mwandishi | Morn |
| Matoleo mengine |
|

Hatimiliki
I, the copyright holder of this work, hereby publish it under the following license:
| This file is made available under the Creative Commons CC0 1.0 Universal Public Domain Dedication. | |
| The person who associated a work with this deed has dedicated the work to the public domain by waiving all of their rights to the work worldwide under copyright law, including all related and neighboring rights, to the extent allowed by law. You can copy, modify, distribute and perform the work, even for commercial purposes, all without asking permission.
|
Python source code
#!/usr/bin/env python3

from pylab import *	     # uses Matplotlib
import matplotlib.dates as mdates
import datetime

#    Data from HTML source at http://top500.org/statistics/perfdevel/
#     and https://en.wikipedia.org/w/index.php?title=Supercomputer&oldid=380073785
li = """
1938,1
1941,20
1943,5000
1944,25000
1946,50000
1954,67000
1956,83000
1958,400000
1960,250000

1961,1.2
1964,3
1969,36
1974,100
1975,150
1976,250
1981,400
1983,941

1984,2.4
1985,3.9
1989,10.3
1990,23.2

1993-05-01,59.7,0.42,1128.57
1993-10-01,124,0.47,1493.35
1994-05-01,143.4,0.84,2317.01
1994-10-01,170,1.16,2732.24
1995-05-01,170,1.96,3927
1995-10-01,170,2.49,4784.34
1996-05-01,220.4,3.31,5892.24
1996-10-01,368.2,4.62,7981.24
1997-05-01,1068,7.67,12844.19
1997-10-01,1338,9.51,16898.12
1998-05-01,1338,13.39,22625.14
1998-10-01,1338,17.12,29367.6
1999-05-01,2121,24.7,39062.57
1999-10-01,2379,33.09,50938.56
2000-05-01,2379,43.82,64230.11
2000-10-01,4938,55.3,88082.45
2001-05-01,7226,67.78,108276.78
2001-10-01,7226,94.3,134977.51
2002-05-01,35860,134.3,222263.77
2002-10-01,35860,195.8,291814.16
2003-05-01,35860,241.4,370049.26
2003-10-01,35860,378.6,526740.41
2004-05-01,35860,606.9,812313.21
2004-10-01,70720,840.02,1128834.52
2005-05-01,136800,1166,1694886.64
2005-10-01,280600,1645.7,2299341.68
2006-05-01,280600,2026,2789465.47
2006-10-01,280600,2736.9,3527867.61
2007-05-01,280600,4031,4950600.48
2007-10-01,478200,5937.33,6977593.51
2008-05-01,1026000,8996.78,12152691.08
2008-10-01,1105000,12593.5,17373520.05
2009-05-01,1105000,17110,22640789.57
2009-10-01,1759000,20070,28006450.09
2010-05-01,1759000,24670,32434684.56
2010-10-01,2566000,31124.36,43786881.73
2011-05-01,8162000,40187.29,58930025.84
2011-10-01,10510000,50941.4,74069633.68
2012-05-01,16324751,60824.4,123417786.71
2012-10-01,17590000,76411,162139386.75
2013-05-01,33862700,96619,223654338.13
2013-10-01,33862700,117831.30,250080467.17
2014-05-01,33862700,133700,273763781.09
2014-10-01,33862700,153381,308850512.09
2015-05-01,33862700.00,164559,359296049.36
2015-10-01,33862700.00,206304,417807043.60
2016-05-01,93014593.88,286100,567353038.81
2016-10-01,93014593.88,349333,672112377.49
2017-05-01,93014593.88,432200,748700301.81
2017-10-01,93014593.88,548672,845120504.67
2018-05-01,122300000.00,715551,1210914864.08
2018-10-01,143500000.00,874800,1414955581.78
2019-05-01,148600000,1021000,1559575379.78
2019-10-01,148600000,1142000,1646887142.78
2020-05-01,415530000,1228000,2206134393.77
2020-10-01,442010000,1316840,2428761851.77
2021-05-01,442010000,1511000,2786058799.77
2021-10-01,442010000,1649110,3036861783.77
"""

x1, y1, x2, y2 = [], [], [], []

for line in li.splitlines():
	if ',' not in line:
		continue
	e = line.split(',')
	if '-' not in e[0]:
		m,d = 1,1
		y = int(e[0])
	else:
		y, m, d = [int(w) for w in e[0].split('-')]
	f = float(e[1])
	if y > 1983:
		mult = 1e9
	elif y > 1960:
		mult = 1e6
	else:
		mult = 1
	if y < 1960:
		y2.append(mult*f)
		x2.append(datetime.date(y, m, d))
	else:
		y1.append(mult*f)
		x1.append(datetime.date(y, m, d))

figure(figsize=(14,9))

semilogy(x1, y1, label = "FLOPS", lw = 2, color = "blue", marker = "d")
semilogy(x2, y2, label = "OPS", lw = 2, color = "green", marker = "p")
legend(loc = "upper left")
xlabel('Year')
ylabel('Peak speed (Rmax)')
grid('on')
xticks([datetime.date(y,1,1) for y in range(1935, 2040, 5)])
yticks([10**q for q in range(-1, 20)])
axis((datetime.date(1937,1,1), datetime.date(2025,1,1), .1, 1e19))
ax = gca()
ax.xaxis.set_major_formatter(mdates.ConciseDateFormatter(ax.xaxis.get_major_locator()))

savefig("Supercomputing-rmax-graph.svg")
show()
Historia ya faili
Bonyeza tarehe/saa kuona faili kama ilivyoonekana wakati huo.
| Tarehe/Saa | Picha ndogo | Vipimo | Mtumiaji | Maelezo | |
|---|---|---|---|---|---|
| sasa hivi | 13:16, 24 Machi 2022 | | 1,260 × 810 (60 KB) | Morn | updated |
| 22:36, 14 Januari 2019 |  | 1,260 × 810 (55 KB) | Morn | updated | |
| 10:29, 28 Julai 2015 |  | 1,260 × 810 (62 KB) | Morn | updated | |
| 12:46, 14 Desemba 2014 |  | 1,260 × 810 (62 KB) | Morn | updated | |
| 11:48, 11 Mei 2014 |  | 1,260 × 810 (62 KB) | Morn | {{Information |Description ={{en|1=Plot of highest supercomputer performance over time}} |Source ={{own}} |Author =Morn |Date =2014-05-11 |Permission = |other_versions = }} [[Category:History of computing... |
Matumizi ya faili
Kurasa hizi 2 zimeunganishwa na faili hili:
Matumizi ya faili ulimwenguni
Wiki nyingine hutumia faili hizi:
- Matumizi kwa ca.wikipedia.org
- Matumizi kwa en.wikipedia.org
- Matumizi kwa fr.wikipedia.org
- Matumizi kwa hi.wikipedia.org